Reading a vLLM Startup Log: A Field Guide to LLM Inference Concepts

Anatomy of the LLM inference stack
Most explanations of "how LLM inference works" are diagrams drawn after the fact. But every time you start a serving engine like vLLM, it narrates the whole thing to you in real time—how big the context window is, how the KV cache is sized, what precision the weights are in, how the graph gets compiled. The startup log is the most honest tour of inference internals you'll find. You just have to know how to read it.

To make that concrete, I took a real cold-start log from a vLLM deployment of Gemma 4 (31B, NVFP4) on an H100 and annotated it line by line. Every interesting line is tagged, grouped into phases, and explained—what the number means, why it's there, and which knob it maps back to. This post is the conceptual companion: it walks through the same startup sequence as a way to understand the dimensions of inference and the concepts attached to each one.

The annotated log

This post explains the concepts. The annotated log shows them in the wild—30 tagged entries across 7 startup phases, filterable by category, with the raw output inline.

Open the annotated vLLM startup log →

Why a startup log is a good teacher

A forward pass is hard to observe—it's milliseconds of GPU kernels. But startup is slow and verbose, and it forces the engine to commit to numbers: how many tokens fit in cache, how much VRAM the weights take, how much is left over. Those commitments are exactly the trade-offs that govern inference. Read in order, the log tells a story in seven phases.

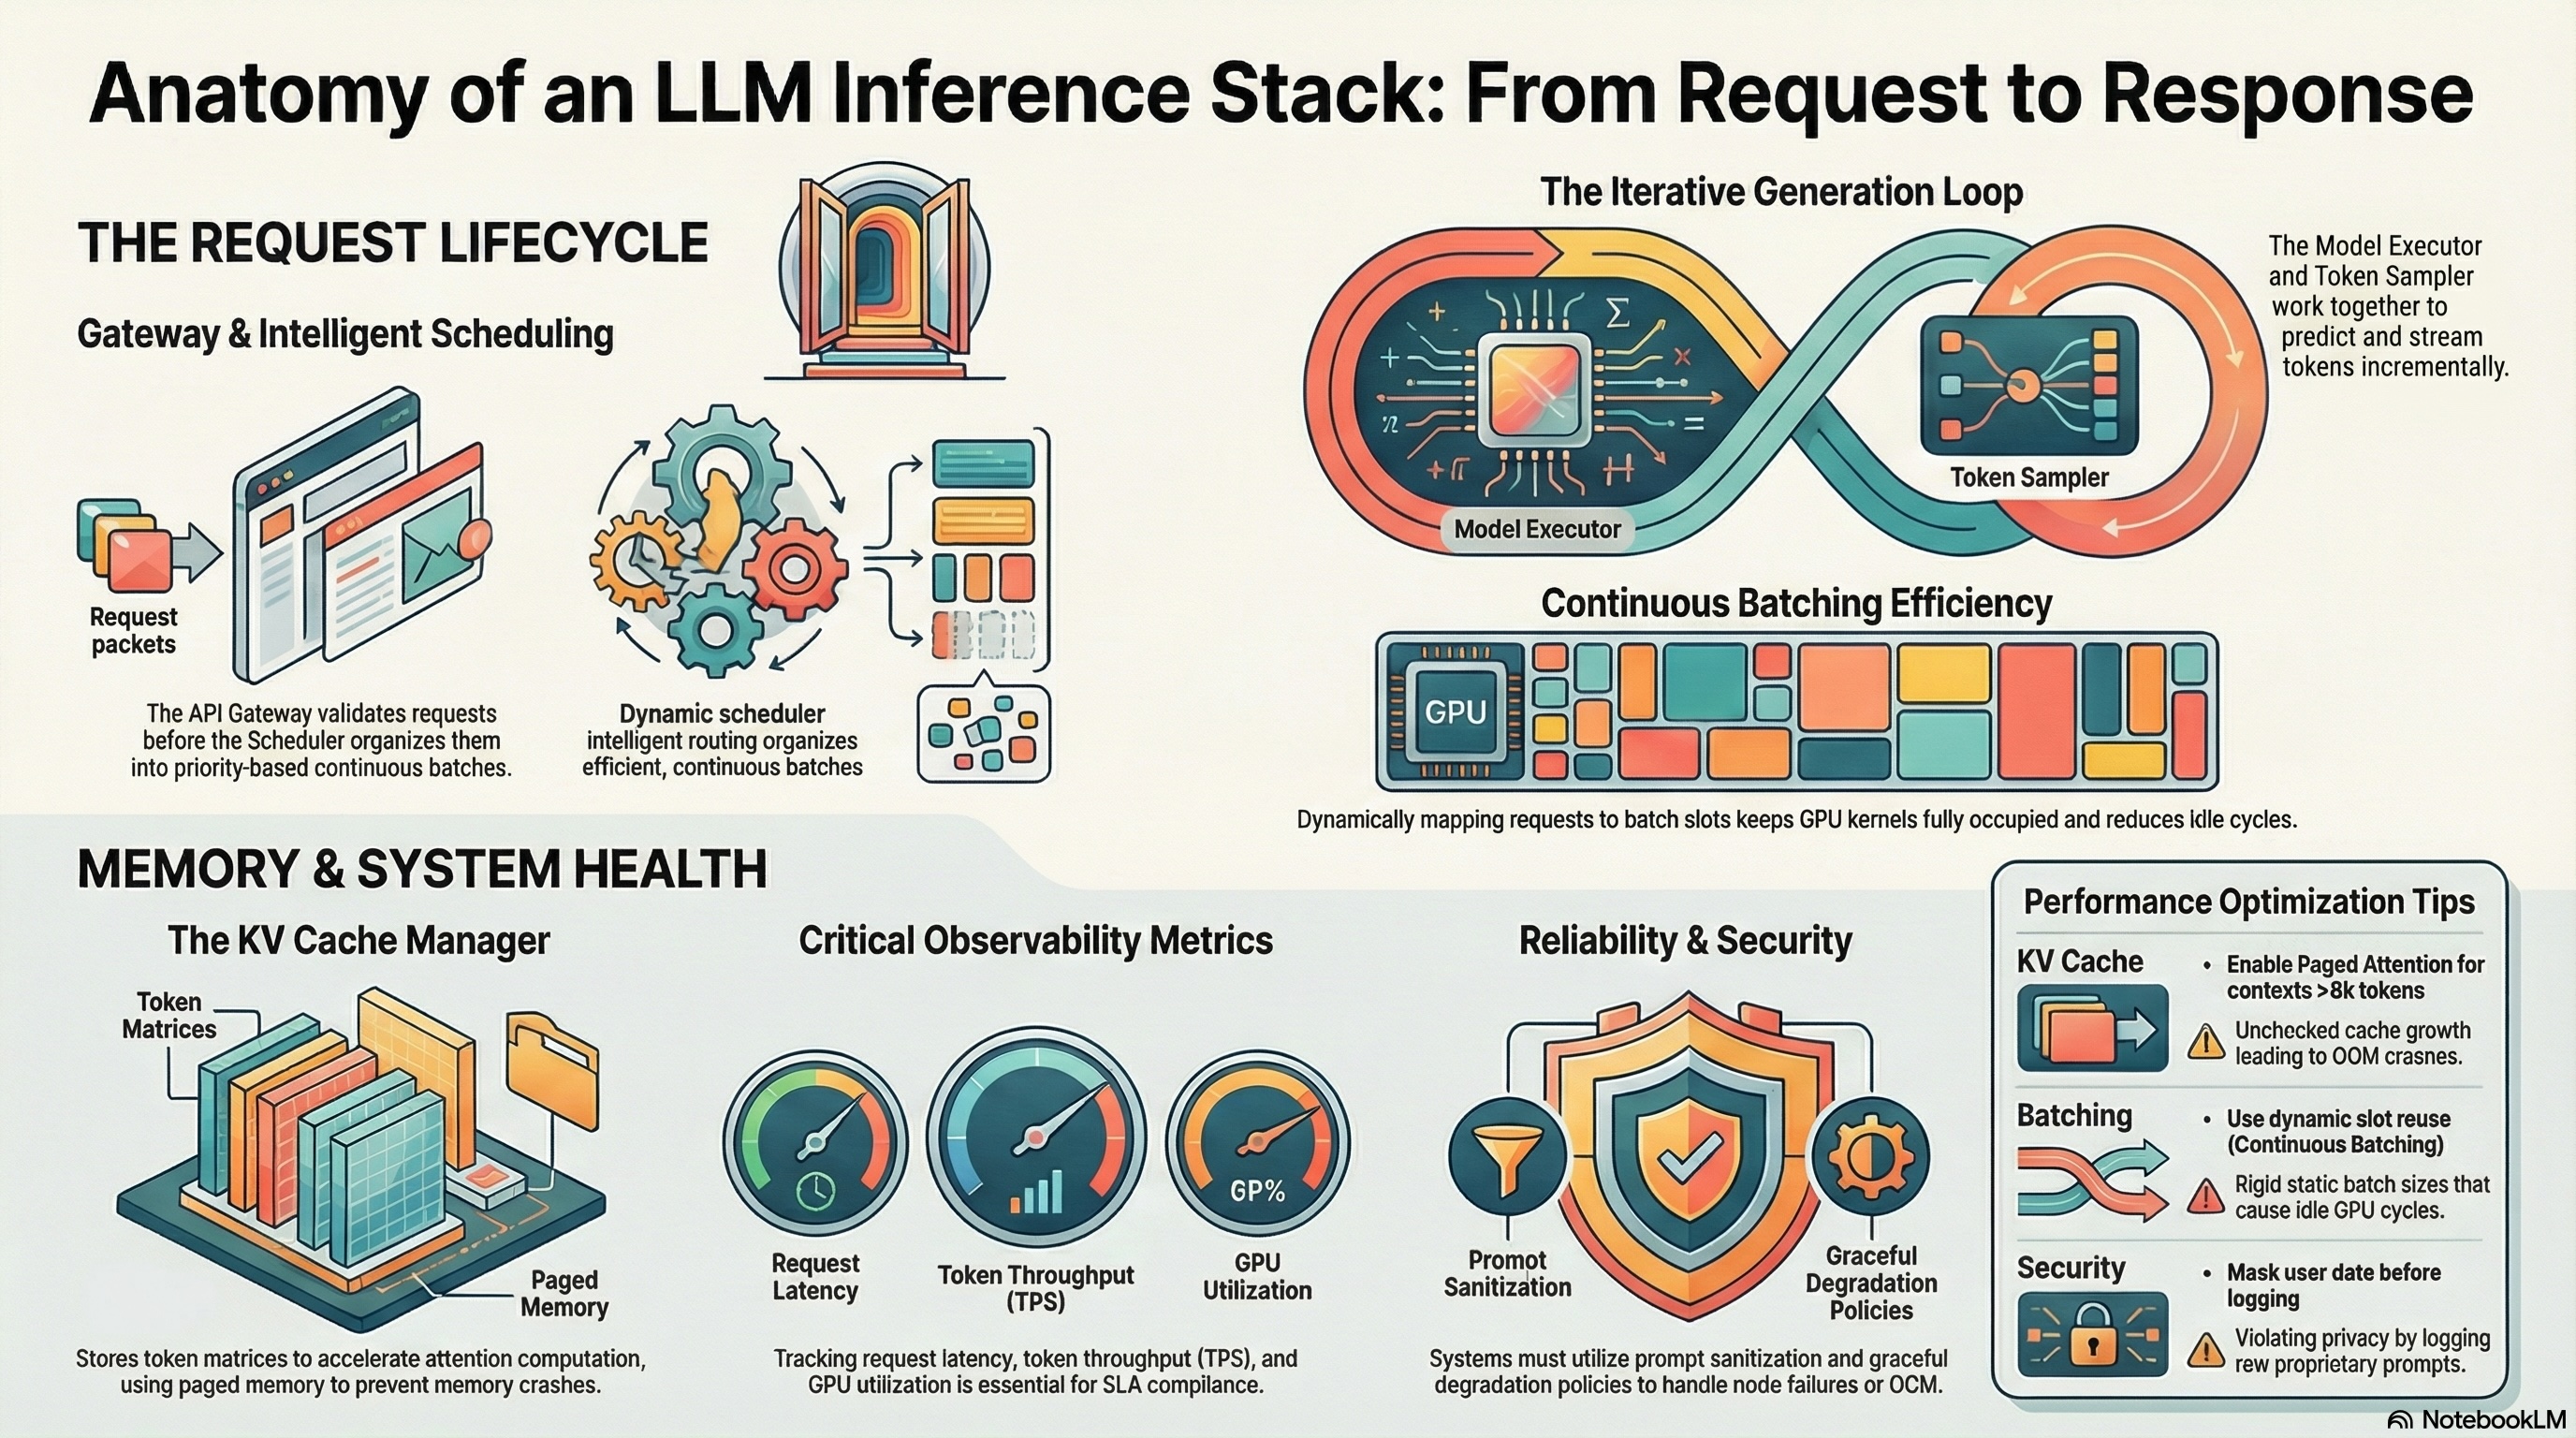
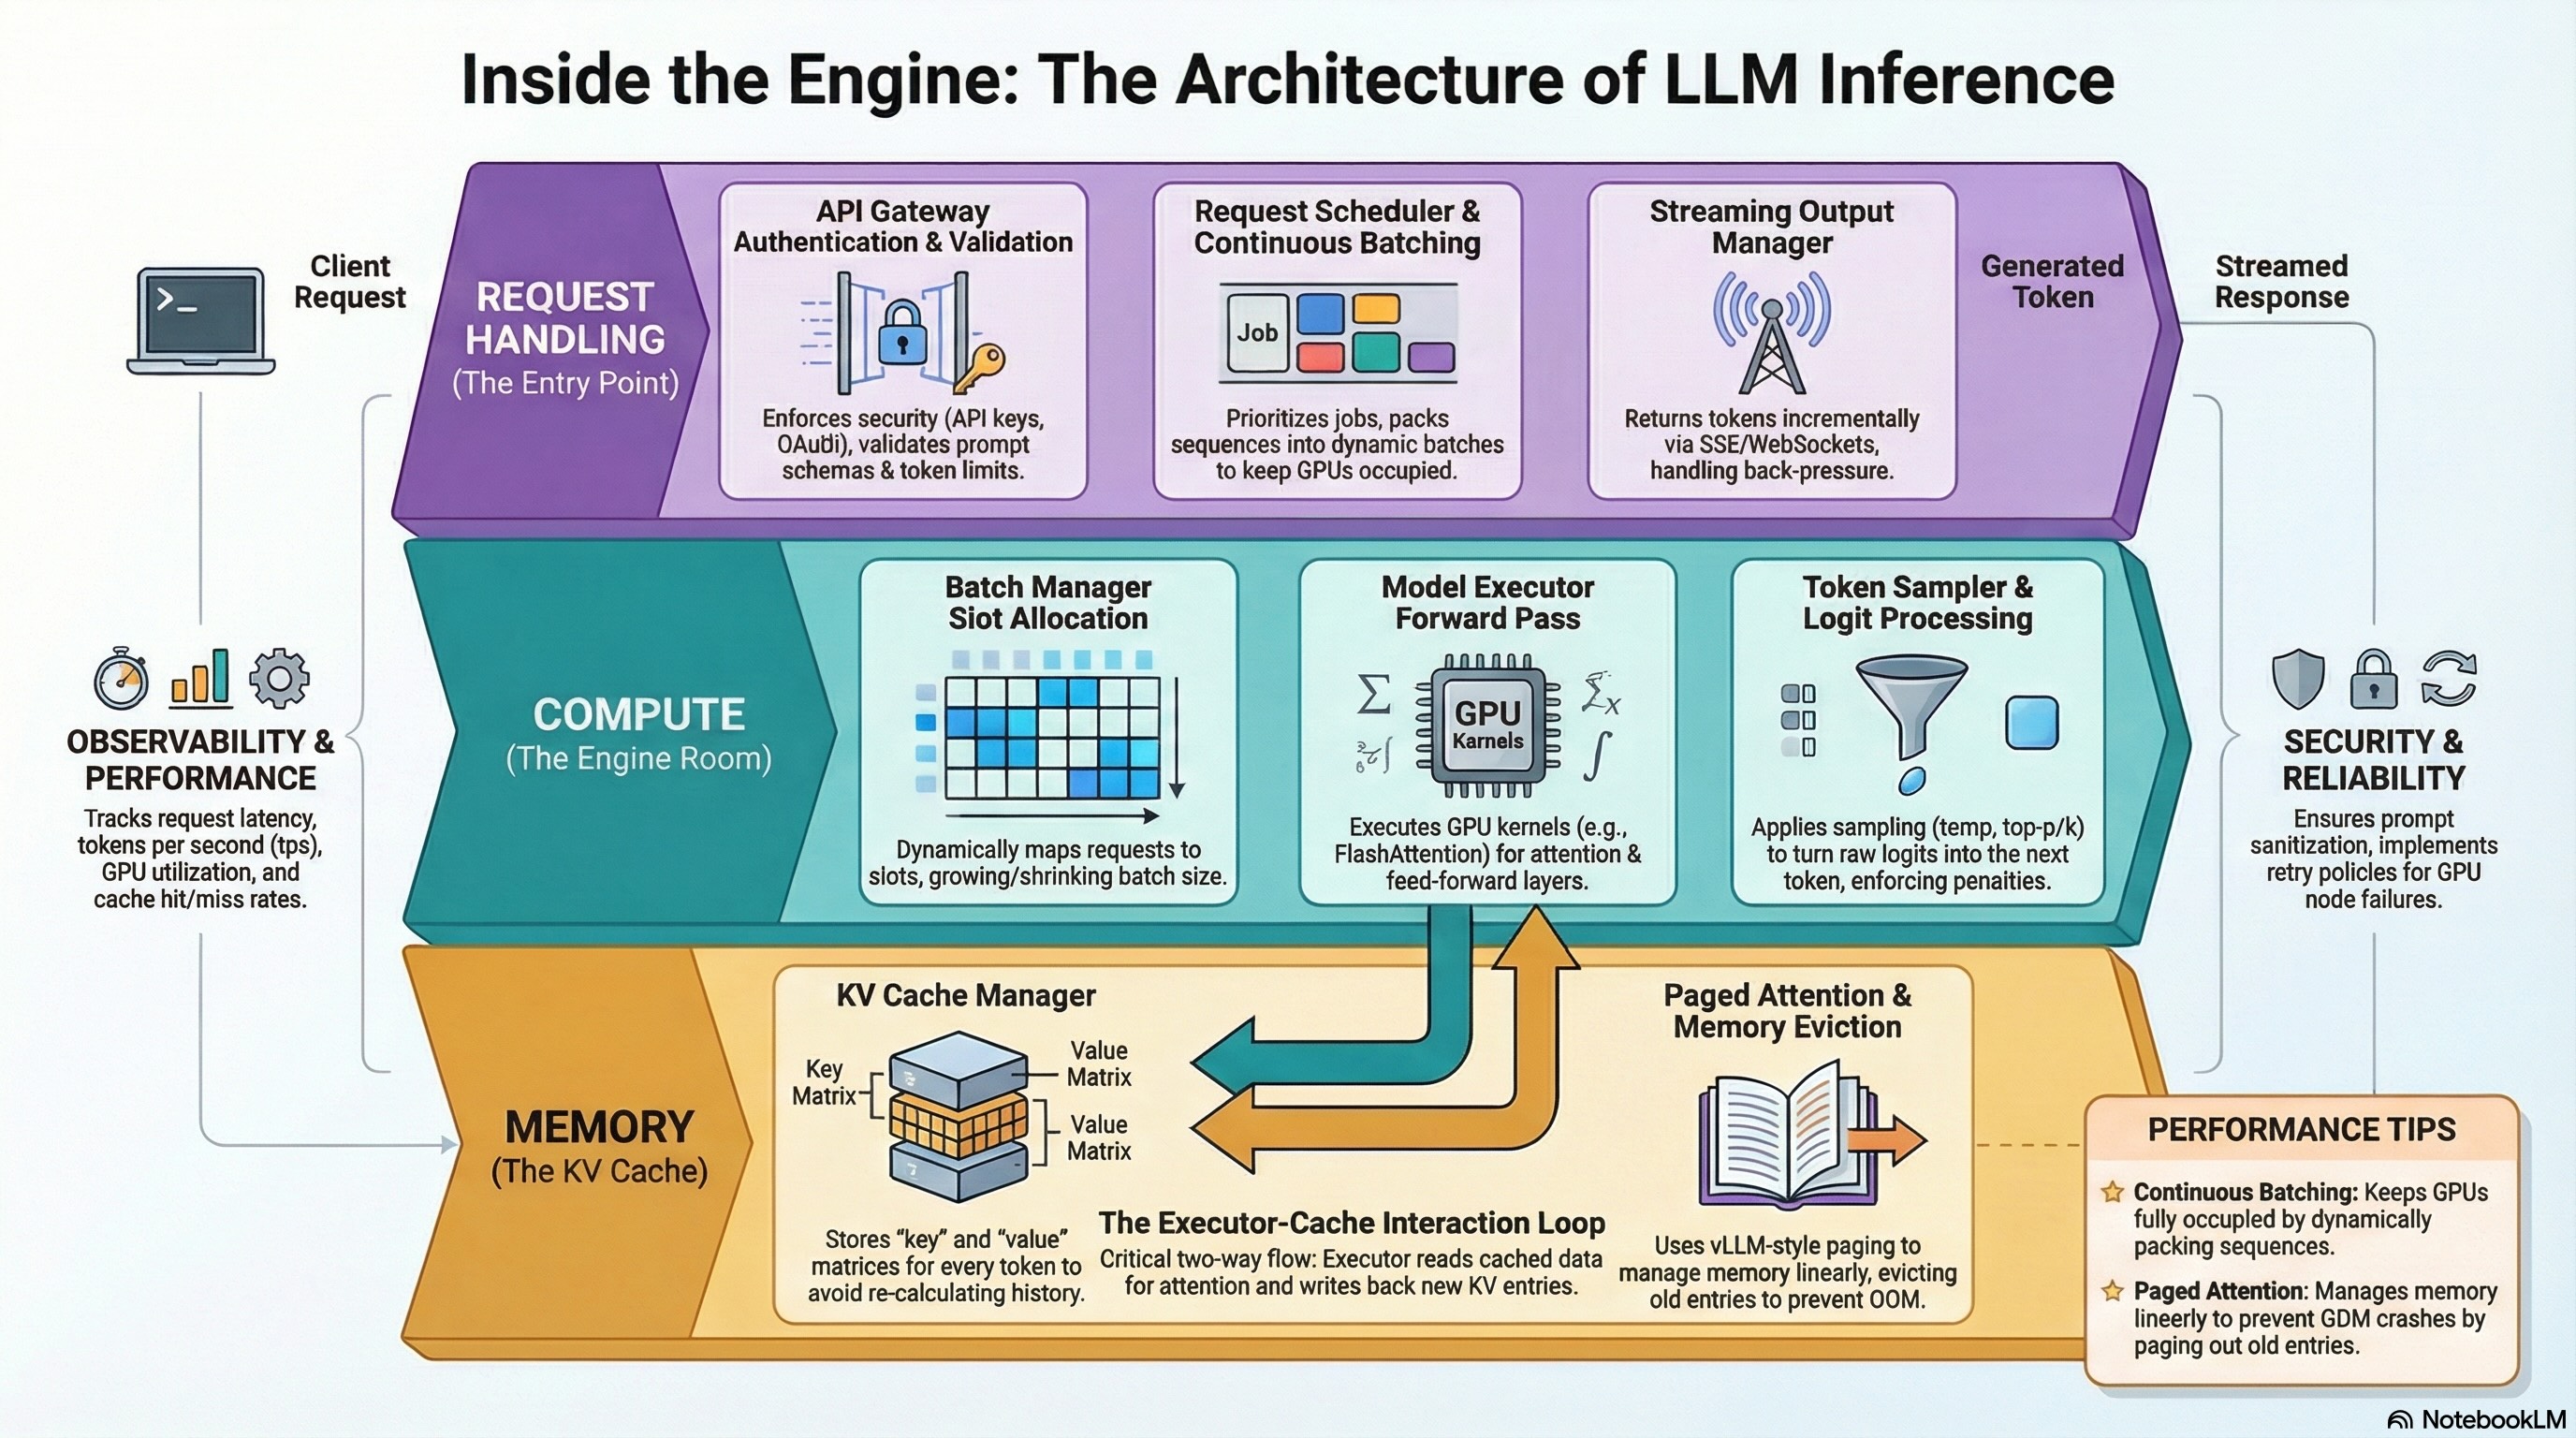
Phase by phase: the dimensions of inference

01 Process startup & model identification
The engine prints its non-default arguments and the model it's loading. This is where you confirm the model, batching limits like max_num_batched_tokens, and parallelism layout before anything expensive happens.
02 Quantization, KV cache format & attention backend
Two of the most important dimensions land here. The context window (max_position_embeddings, 262,144 tokens for this model) sets the ceiling the cache must support. The KV cache dtype (fp8_e4m3) decides how many tokens fit per byte of VRAM—FP8 roughly doubles capacity versus BF16. This is also where the weight quantization format (NVFP4) and the attention backend are chosen.
03 Model download & weight loading
The longest wall-clock phase on a cold start. Weights stream from disk and land in VRAM at their quantized footprint (31.18 GiB here). The size of this number directly determines how much memory is left for everything else—above all, the KV cache.
04 FP8 scaling & encoder cache
FP8 has a narrow dynamic range (E4M3 maxes out at 448.0), so the cache needs scaling factors (k_scale, v_scale, ideally q_scale) to map activations into that range. Missing or default scales are a quiet correctness risk—values that exceed the range get silently clipped. For multimodal models, this phase also profiles the encoder's memory with a dummy worst-case input.
05 torch.compile & Inductor
torch.compile traces the model with Dynamo and generates optimized kernels with Inductor. This is expensive on a cold start (~60s here) but cached by a hash of the graph + config—which is why a warm restart is dramatically faster. Understanding this phase explains the gap between a ~13-minute cold start and a ~40-second warm one.
06 CUDA graph capture & KV cache sizing
The payoff phase. CUDA graphs pre-record GPU command sequences so each decode step skips per-launch CPU overhead. Their memory is profiled and subtracted before the KV cache is sized—which is why --gpu-memory-utilization doesn't mean quite what it used to. What's left becomes the cache: 71.34 GiB → 1,563,739 tokens → ~6× concurrency at full context. This is where all the earlier numbers resolve into capacity.
07 API server startup & route registration
The engine binds its HTTP server and registers routes. Once you see this, the model is live and serving—and every dimension from the previous phases is now fixed for the life of the process.

The concepts worth internalizing

If you take away nothing else, these are the levers the log keeps pointing at:

  • Context window vs. KV cache. The window is the per-request ceiling; the cache is the shared budget. Concurrency is the cache divided by how much each active sequence consumes.
  • Precision is a capacity decision. FP8/FP4 aren't just "smaller"—they change how many tokens and users fit on a card, with correctness caveats around scaling factors.
  • Compilation is amortized, not free. The cold-start cost buys faster steady-state kernels and is cached for warm restarts.
  • CUDA graphs trade startup time for decode throughput, and quietly reshape what --gpu-memory-utilization delivers.
Architecture of LLM inference

Ready to see these phases in the raw output? The annotated reference has the full log, filterable by key decisions, warnings, architecture, memory, and compilation.

Read the annotated vLLM startup log →